

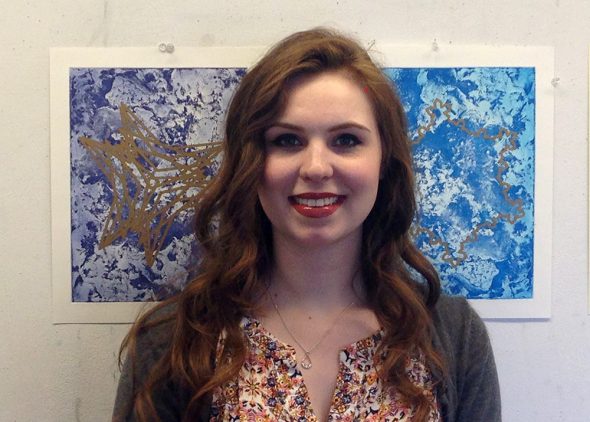
Global climate change has been called the single most significant threat to human existence. Drake senior Marie Dolleman found a way to make it hauntingly beautiful.
Using a combination of her three majors, mathematics, computer science and painting, Dolleman created a single art project, one which exhibits the carbon emissions of eight countries around the world.
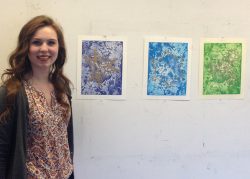
The project is as remarkable for its scientific rigor and painstaking process—involving complex math, high heat, an acid bath, and a robot—as for its artistry. The project consists of nine pieces of paper lined in a row, eight countries and the control. The colors on each piece progress, from the first page to the last, green to purple, with green representing places on Earth that are more climate-friendly.
The carbon-eroded plate used to stamp the ink onto the paper gives each piece a gaseous look, meaning the colors, such as kelly green or aqua blue, are darker in certain places. Then, drawn on each piece of paper, is an infinitely repeating pattern. Each piece of paper has a different pattern as the lines and angles illustrate the carbon emissions data of the country it represents.
“I liked the idea of finding a way for my art friends to really have a way to be interested in the numbers,” said Dolleman. “Many artistically inclined people can absorb details, information and symbolism from artworks over a period of hours. However, they can find it difficult to take that kind of time and attention to detail with a simplistic line graph presenting data. If we truly want to inspire viewers to dive into the details of data, why not present it in such a way as to spark their curiosity and attention?”
Phillip Chen, Drake University’s Ellis and Nelle Levitt Distinguished Professor of Art and Design, was impressed with the aesthetic of Dolleman’s piece and how it is predicated on hard science, mathematics and research methodologies.
“I see a lot of art done by artists that don’t have science experience that merely emulate the look of scientific works and there’s no science in it,” said Chen. “I’m always taken by projects where visual experience really is truly loaded with scientific inquiry, which is what Marie’s piece is.”
Dolleman chose eight countries to showcase in her project: Uganda, Bhutan, Tunisia, Costa Rica, Malaysia, the Netherlands, Australia and the United States. She picked them by geographical location crossed with the income of each country, as well as personal significance.
Using carbon emissions data, Dolleman inserted the numbers into a formula, calculating lines and angles specific to each country. It was a time-consuming process for the Des Moines native, especially since she did all the math by hand.
“I spent two weekends in a row doing eight hours’ worth of math a day,” said Dolleman. “That was after many weekends of doing math for four or five hours a day.”
Then, using a computer script she programmed herself, Dolleman transformed the lines and angles calculated into the shapes found on each part of project, called fractals, which are infinitely repeating patterns. She then used a robot called an AxiDraw to create the same shapes on paper.
“I calculated all of the angles, wrote the code to draw the fractals on my computer and then sent that image to the AxiDraw, and the AxiDraw drew it,” Dolleman explained.
Assistant Professor of Mathematics Chris Porter suggested Dolleman try the AxiDraw because of Dolleman’s interest in topology, the study of geometric properties and spatial relations unaffected by the continuous change of shape or size of figures. The AxiDraw is commonly used in topology, and it filled a role that traditional laser printers could not because of the materials Dolleman used in her process.
“Given the specific parameters she used to produce each image, Marie created fractals that have never been created by anyone before—that’s pretty special,” Porter said. “I think Marie’s synthesis of art and math/computer science speaks to both the exciting interactions between these two areas, but also to the quality of Marie’s education here at Drake, where she can bring her training in fine arts and math/computer science to produce such original and compelling work.”
In a sophisticated process, Dolleman used a zinc plate, carbon particles, 500 degrees of heat and acid to give the project its gaseous background, all of which adds to the creation of topography. Bronze, silver and gold Sharpie permanent markers were used to draw the shapes, each representing the income of the country.
“This project is a combination of art and science and what has happened is that the research, the inquiry, the methodologies have created a new subjectivity,” said Chen. “That’s what I like about this.”
“Data presented in an artistic way presents an opening for important discussion about the data itself and why it’s important to study the numeric value,” said Dolleman.
Dolleman’s piece will be displayed in the B.F.A. Show starting May 1 at the Anderson Gallery.